European civil society groups launched joint action on November 6, demanding a halt to the construction of new large data centers. As facilities are expanded to run artificial intelligence (AI) and cloud services, the issues include how much electricity and water they use, who bears the costs, and what information residents can consult when assessing whether construction should proceed.
High school students can use this debate as an inquiry topic in Integrated Social Studies 2, Integrated Science 2 and Informatics. In Integrated Social Studies 2, they can investigate cost allocation and public participation; in Integrated Science 2, they can analyze energy efficiency and cooling methods; and in Informatics, they can process public statistics and test ways to reduce data use. The general framework of the revised 2022 curriculum calls for connecting content across subjects, applying it to real life and learning each subject's methods of inquiry. High school educational objectives also include the ability to solve problems using knowledge and experience from different fields.
Protests in the Netherlands, electricity consumption in Ireland and efficiency requirements in Singapore
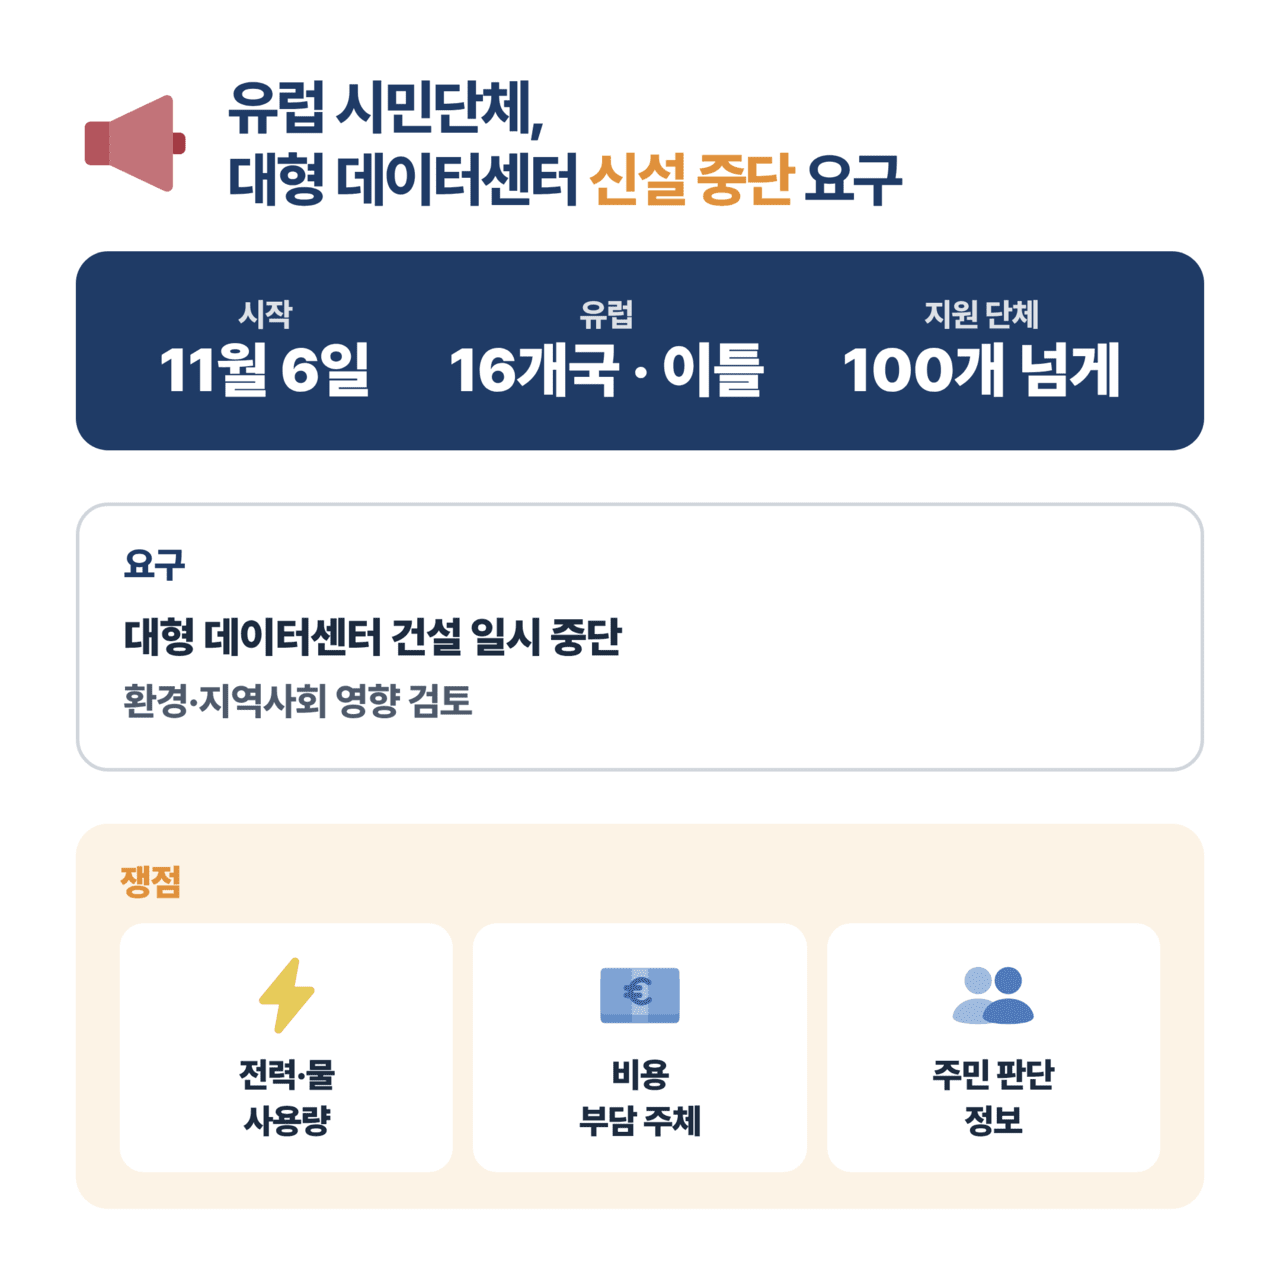
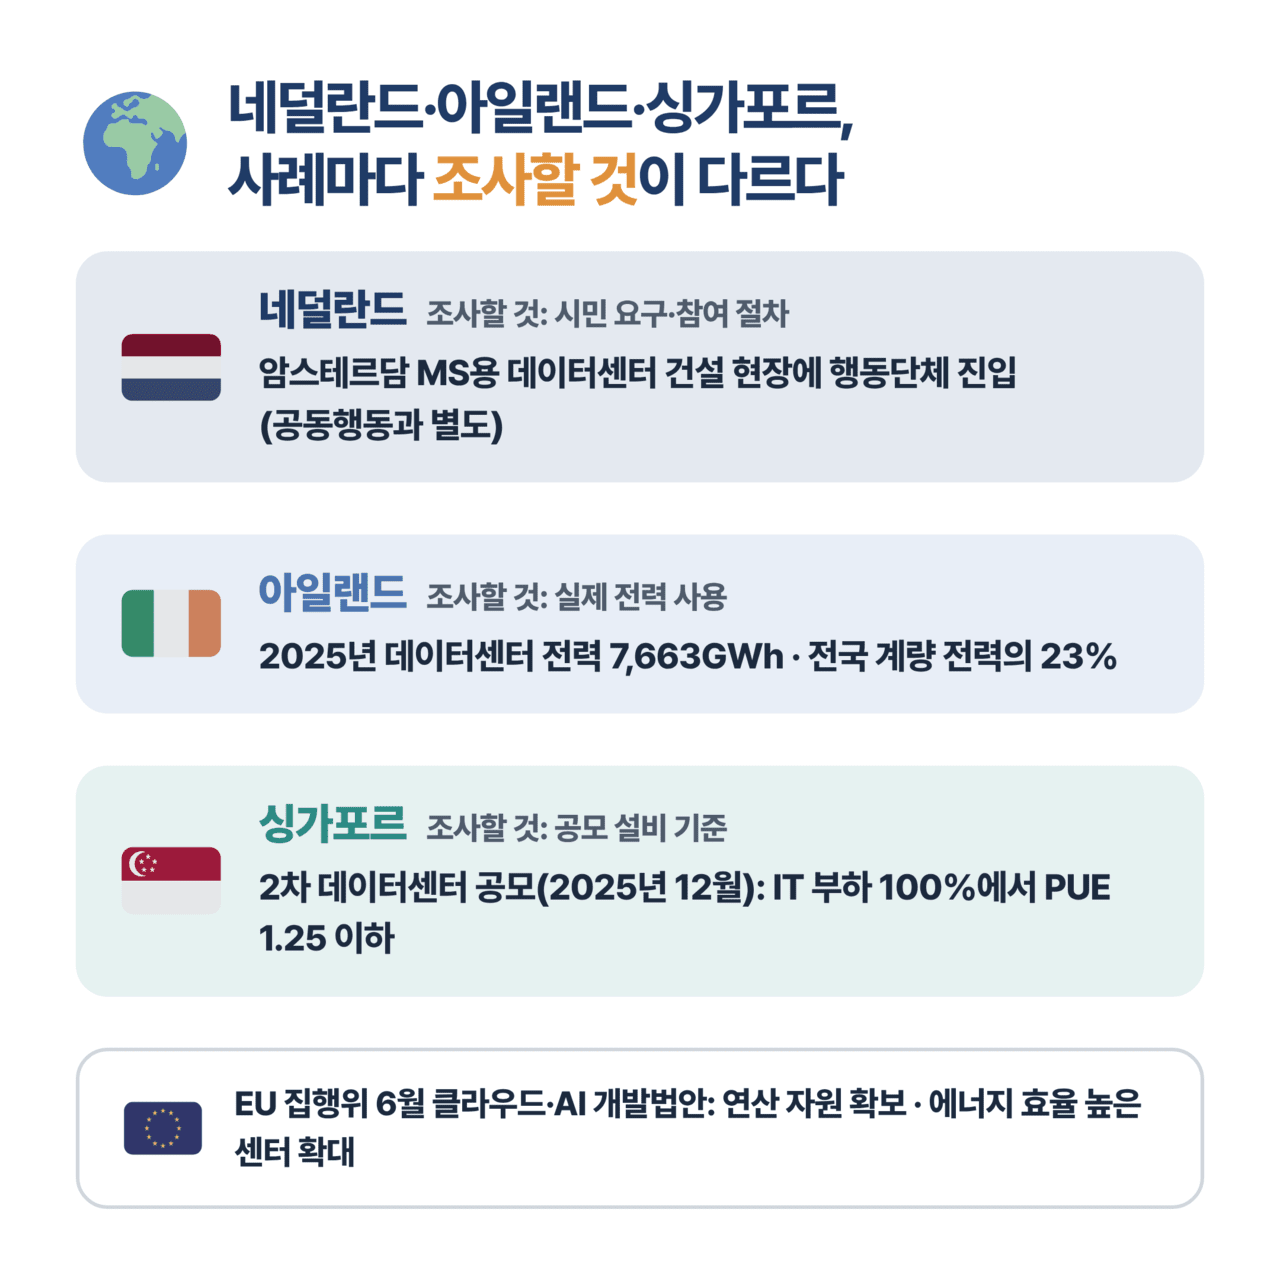
Global Action Plan, the secretariat for the joint action, said on November 6 that events would take place over two days in 16 European countries, supported by more than 100 organizations. Participating groups demanded a temporary halt to large data center construction and a review of its environmental and community impacts. On the same day in Amsterdam, the Netherlands, the activist group Geef Tegengas entered a construction site for a Microsoft (MS) data center, separately from the pan-European joint action.
The objectives of governments pursuing facility expansion also need to be examined. When the European Commission proposed the Cloud and AI Development Act in June 2026, it said it would secure computing resources for businesses and researchers to use AI and expand energy-efficient data centers. Students can investigate both the need for computing facilities and the capacity of local resource supplies when assessing project scale and operating conditions.
Ireland has statistics that show actual consumption. According to Ireland's Central Statistics Office (CSO), data centers consumed 7,663 GWh of electricity in 2025, accounting for 23% of national metered electricity consumption. These statistics compile metered electricity consumption at grid-connected data centers. Students can download and analyze annual consumption and its share of national metered electricity consumption.
Singapore set efficiency requirements when selecting new facilities. In the second data center call for applications, launched in December 2025, the Economic Development Board (EDB) and the Infocomm Media Development Authority (IMDA) required a power usage effectiveness (PUE) of 1.25 or below at a 100% IT equipment load. Students can investigate citizens' demands and participation procedures in the Netherlands, actual electricity consumption in Ireland, and the facility standards for that particular call in Singapore.
Integrated Social Studies 2: Allocating grid and water supply costs
Integrated Social Studies is a subject that develops understanding of social phenomena from temporal, spatial, social and ethical perspectives, examining facts and values to identify solutions. The Integrated Social Studies 2 content area, “Market Economy and Sustainable Development,” covers the limits of rational choice and the roles and responsibilities of economic actors. The explanatory guidance for achievement standard [10 Integrated Social Studies 2-03-02] also calls for examining market failure and corporate social responsibility.
An inquiry could examine what rules should apply to people who benefit from data centers and those who bear electricity and water supply costs. Companies decide on facility investment and operations, local governments assess permits and local development, and residents consider effects on their living environment and utility bills. Students read project plans, permit documents and residents' submissions, recording supporting figures and documents alongside each party's claims.
A comparison table should include employment and tax revenue, grid expansion costs, water supply costs, and procedures for gathering residents' views. Employment should distinguish temporary construction jobs from permanent operating jobs, while tax revenue should distinguish company forecasts from actual tax payments. Students should consult contracts and tariff rules to determine whether grid expansion costs are paid by the developer or shared through public finances or users' bills. If residents bear environmental costs arising from operations while companies neither pay for nor compensate for them, students can examine negative externalities and policies to reduce them.
To investigate public participation further, students can connect the topic to [10 Integrated Social Studies 2-01-02] in “Human Rights Protection and the Constitution.” This standard calls for exploring participation methods that protect citizens' rights and interests. Students check when residents were able to view project plans, whether they had ways to submit comments, and what responses the developer provided, then propose necessary participation procedures.
The results should be presented as a case comparison table and a one-page project review statement. Students state their judgment on whether the project should be approved, conditionally approved, resized or reconsidered in terms of location, and specify verifiable conditions such as disclosure of electricity and water consumption and arrangements for bearing supply costs. If they propose that the project be conditionally approved, they should also explain who would check compliance and what evidence would be used.
Integrated Science 2: Whether greater efficiency reduces electricity and water use
Integrated Science 2 develops the ability to understand everyday and social problems through scientific concepts and inquiry methods and to participate in solving them. Achievement standard [10 Integrated Science 2-02-06] in “Environment and Energy” addresses energy efficiency and sustainable development. Its explanatory guidance calls for explaining energy conversion and conservation of total energy, heat generation and utilization efficiency. For data centers, students can investigate heat generated by operating servers and the cooling equipment that transfers it outside.
A more specific inquiry could examine how changing IT equipment use and cooling methods affects a center's total energy and water consumption. PUE, as explained by the U.S. Department of Energy, is the ratio of the total energy used by a data center to the energy used by its IT equipment over the same period. Students use this ratio to calculate energy consumed by IT equipment and the additional energy used by supporting equipment, including cooling and power conversion systems.
Using hypothetical classroom figures, suppose IT equipment consumes 100 MWh over a year. A center with a PUE of 1.5 consumes 150 MWh in total, while one with a PUE of 1.25 consumes 125 MWh. Energy used outside the IT equipment is 50 MWh and 25 MWh, respectively. If IT equipment consumption then rises to 120 MWh, total consumption reaches 150 MWh even with a PUE of 1.25. By varying facility efficiency and IT equipment consumption separately, students can calculate when total consumption falls or rises.
Water use should be examined alongside cooling methods and local climate. Evaporative cooling uses the principle that water absorbs heat as it evaporates. Electricity and water consumption by cooling equipment varies with temperature and humidity, the heat generated by equipment, and operating settings. Students find material comparing cooling methods under the same climate and IT load conditions to check how electricity-saving methods affect water consumption.
When comparing water use, students should record withdrawals from supply sources and consumption that does not return to the original source after use, following the definitions in the original data. Water used inside the center and water used to generate electricity should also be counted separately. Reports should present PUE calculation tables and electricity and water consumption data for each cooling method, explaining why the selected operating method suits local temperatures or water supply conditions.
Informatics: Analyzing public statistics and testing file compression
Informatics develops the ability to collect data suited to a purpose, organize relationships, and process and visualize the results. In the “Data” area, [12 Informatics 02-03] addresses collecting material suitable for problem-solving, while [12 Informatics 02-04] covers visualization and interpretation using analytical tools. The curriculum explicitly requires teaching that generating, storing, transmitting, receiving and using data also consumes digital resources and electrical energy.
A data-analysis inquiry could examine how much electricity consumption by Irish data centers has increased and how their share of national metered electricity consumption has changed. Students download the CSO's annual tables and organize the year, data center consumption, total national metered electricity consumption and percentage share. They record the date they accessed the material and the publishing institution, comparing values expressed in GWh with other GWh values. If other units are used, they also record the conversion formulas.
Using analytical tools such as spreadsheets or Python, students create separate graphs for annual consumption and percentage share. The consumption graph explains changes in electricity used by data centers, while the share graph explains their proportion of national metered electricity consumption. Students calculate changes in both the numerator and denominator to write an interpretation, leaving undisclosed values as missing data. Actual statistics and forecasts should be marked differently, and any rounding conventions in the original data should be recorded.
Students who want to conduct an experiment can connect it to the analysis of data compression efficiency in [12 Informatics 02-01]. The inquiry can examine how much file sizes for storage and transmission can be reduced while conveying the same information. Using images they created themselves or material they have permission to use, students change compression methods while maintaining resolution and content, comparing file size, image quality, and compression and decompression times. For images containing text, legibility should be included as a quality criterion.
The file experiment results should identify which compression method reduced file size while maintaining the required quality. To compare the test equipment's electricity consumption as well, students should vary compression methods on the same equipment under the same conditions and measure electricity consumed during compression and decompression. Students choosing public statistical analysis can submit the original material, organized data, graphs and interpretation; those choosing compression experiments can submit experimental conditions, comparison files and measurement records.
Original Korean article: kyobit.com
English brief by Korea Wind Intelligence, koreawindintel.com